Sinatra
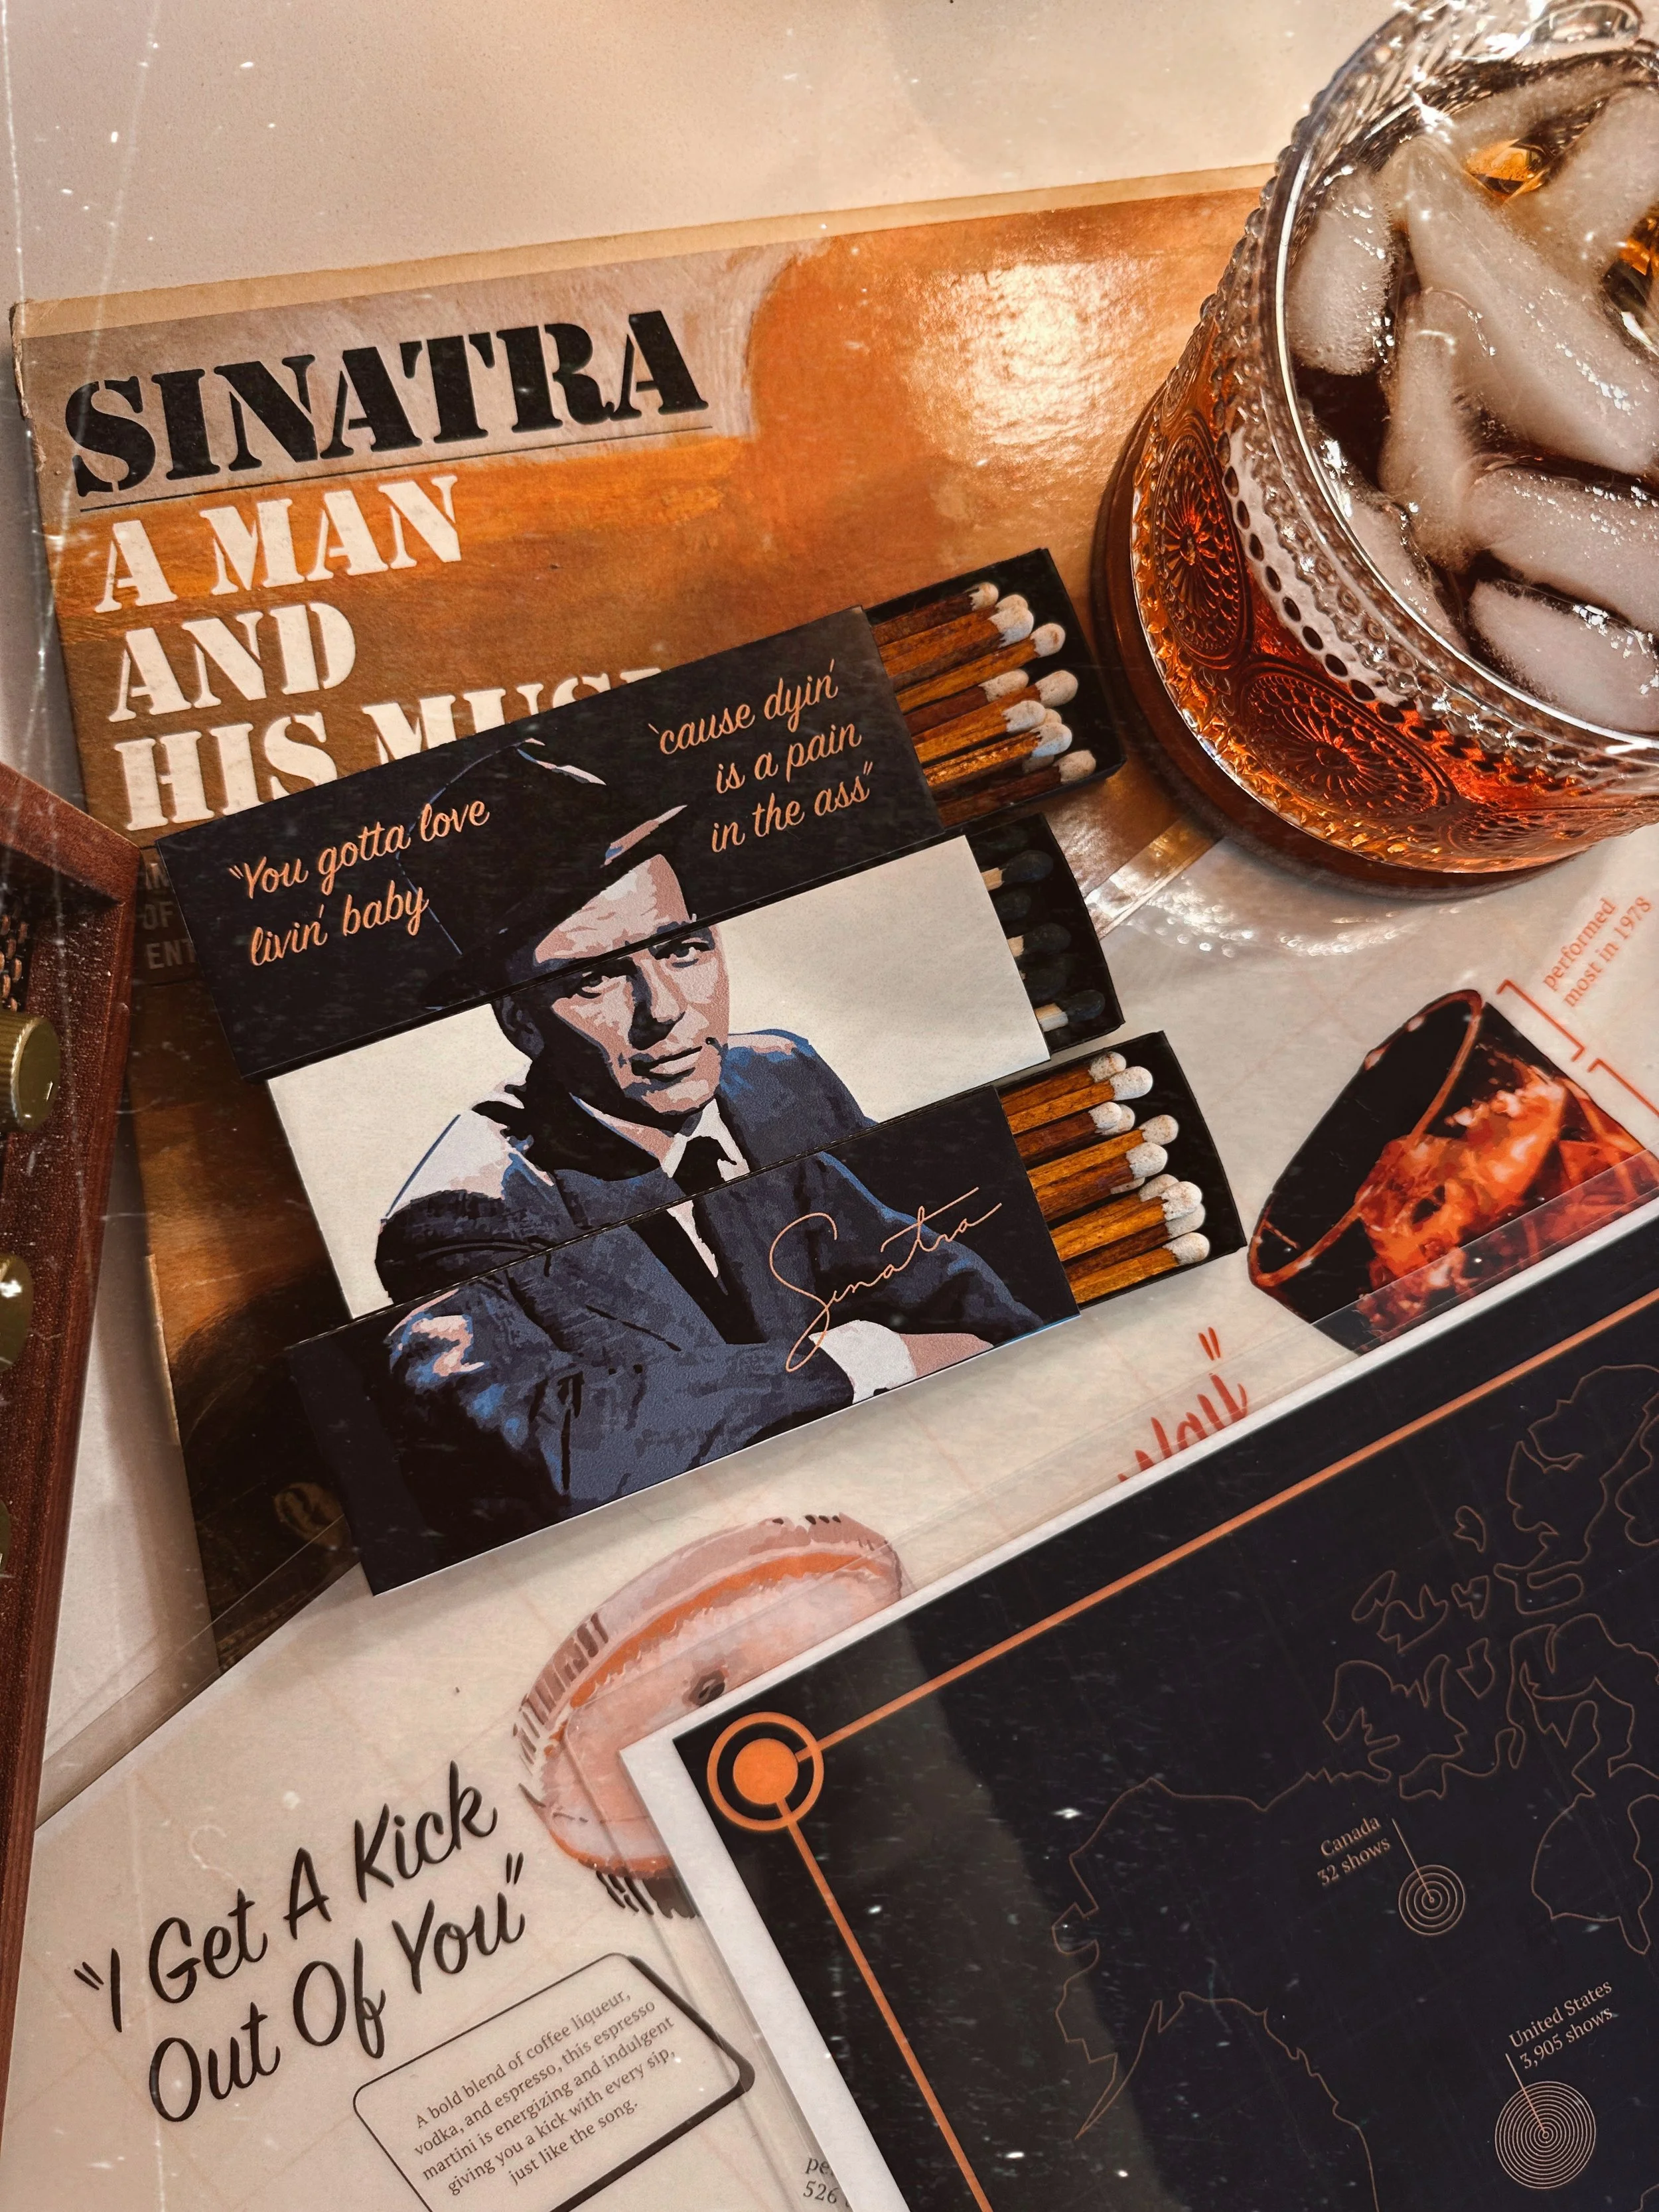
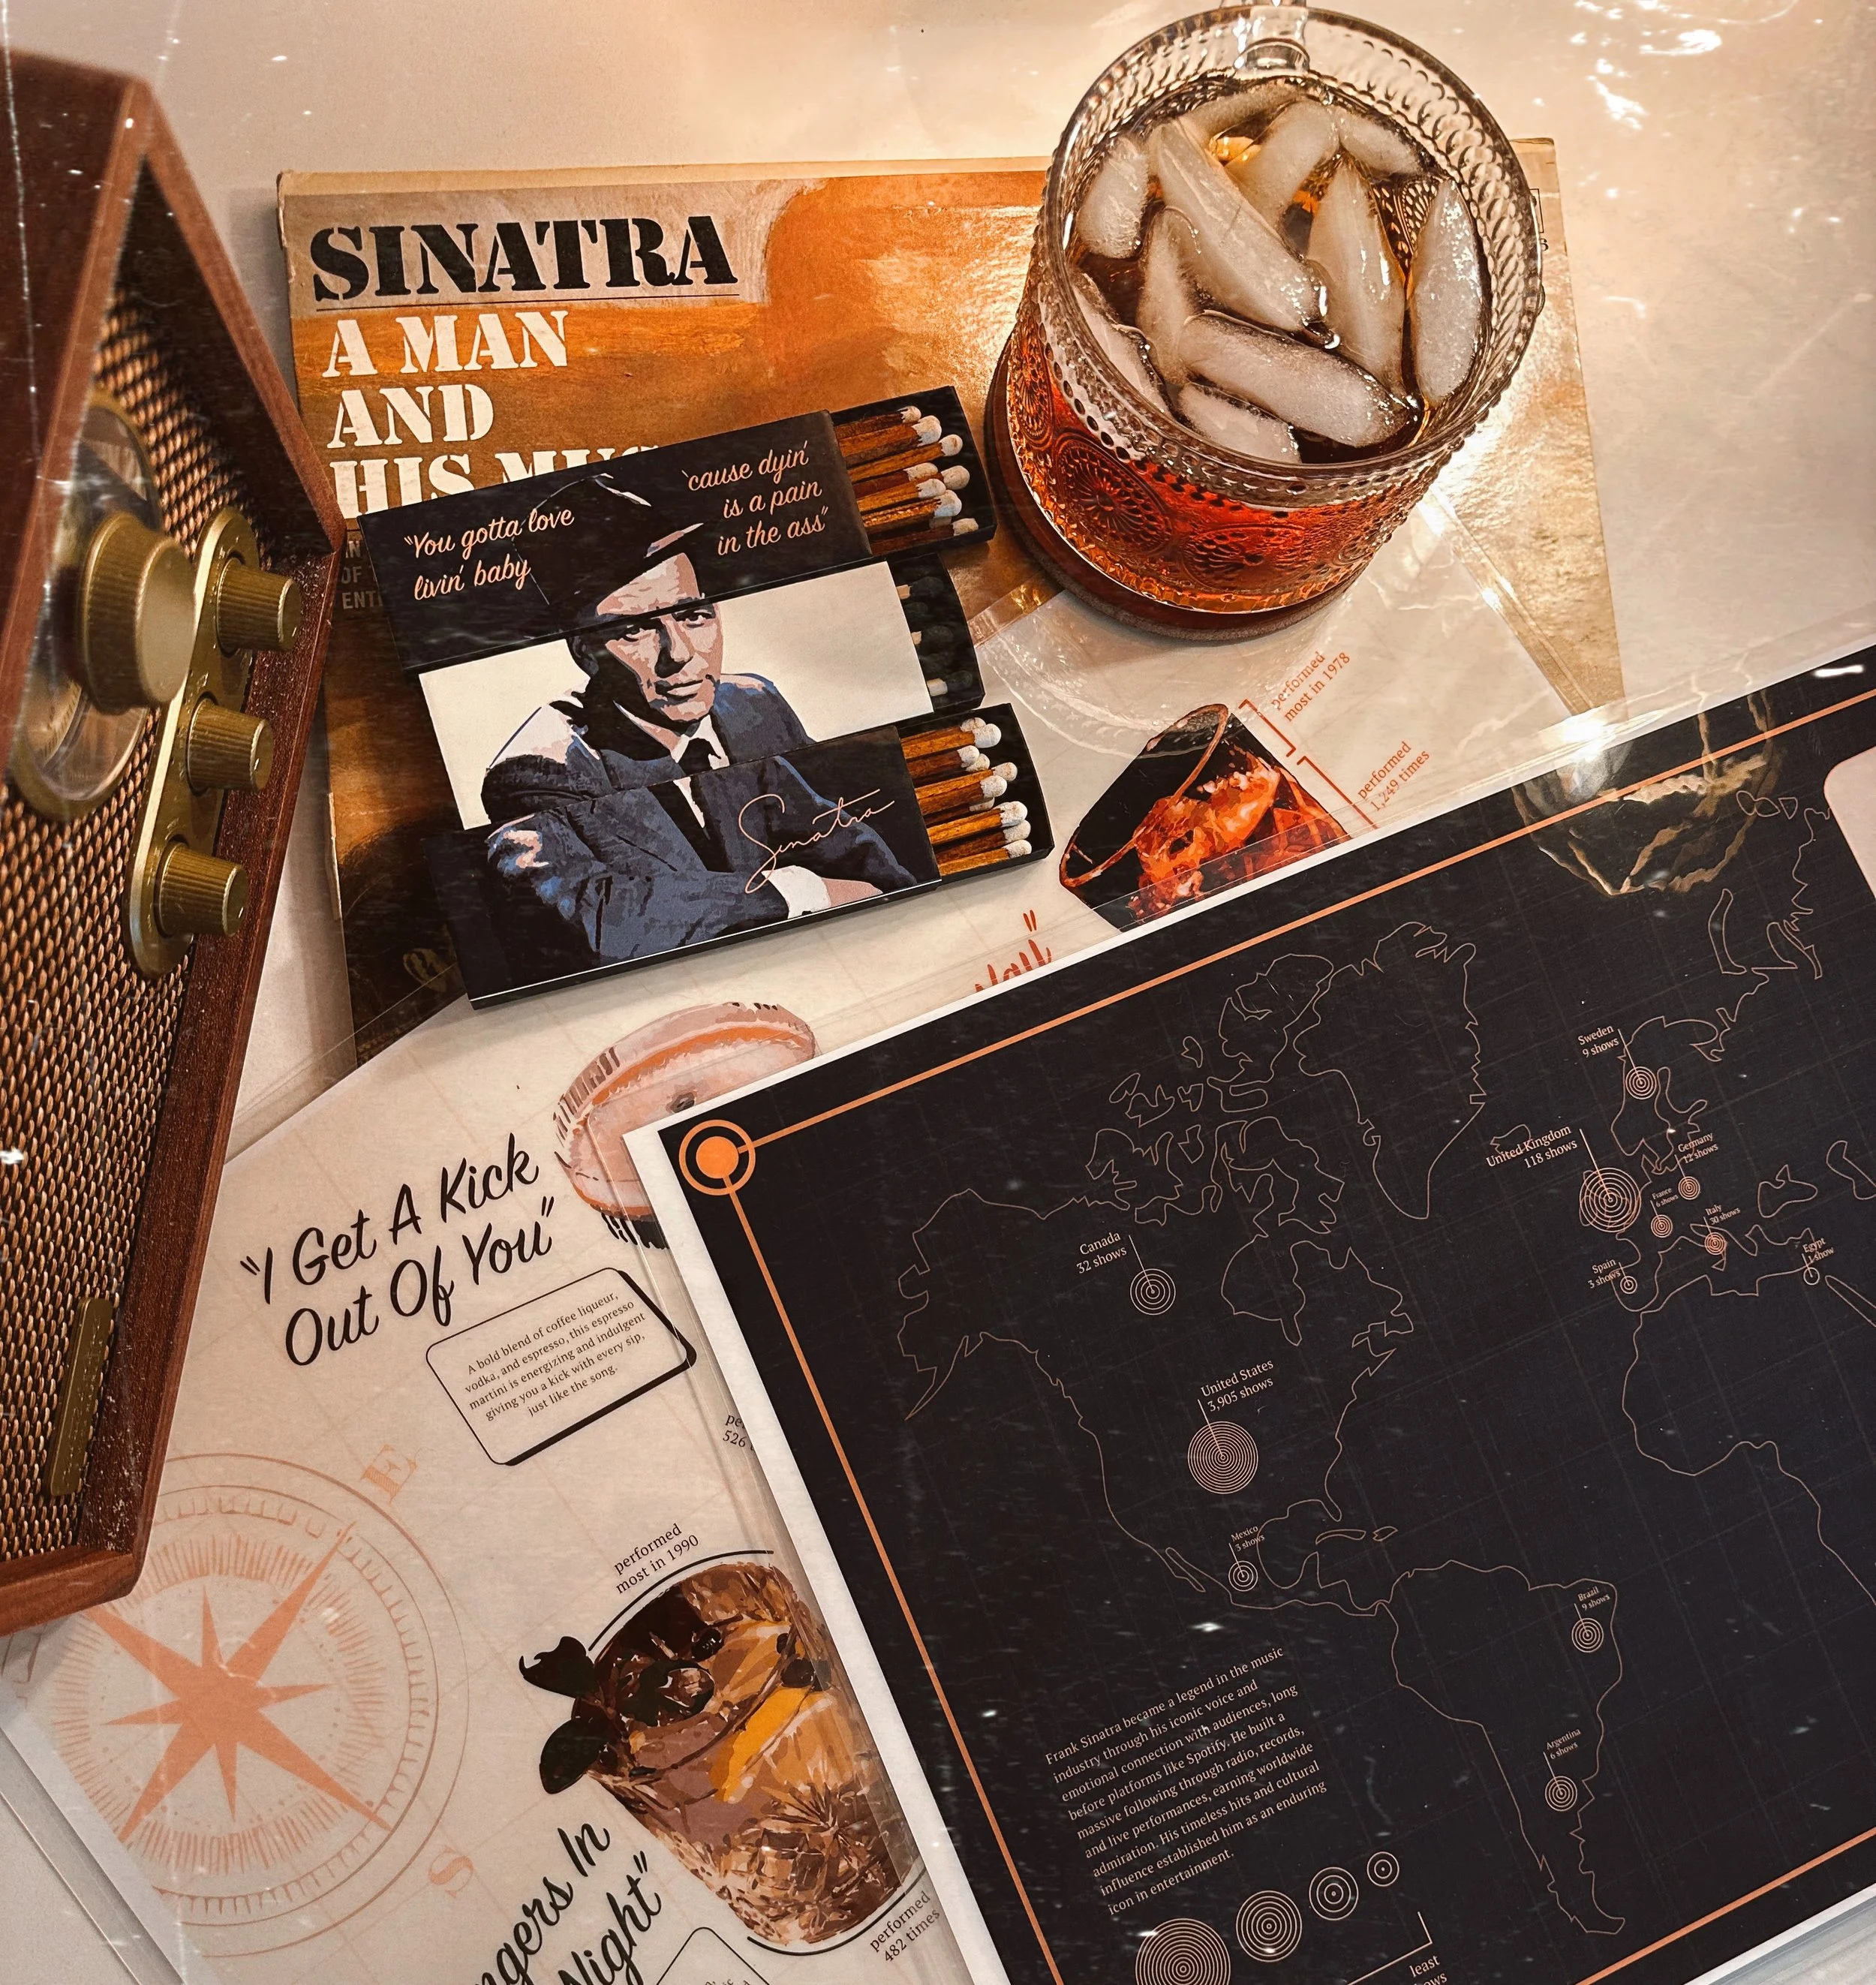
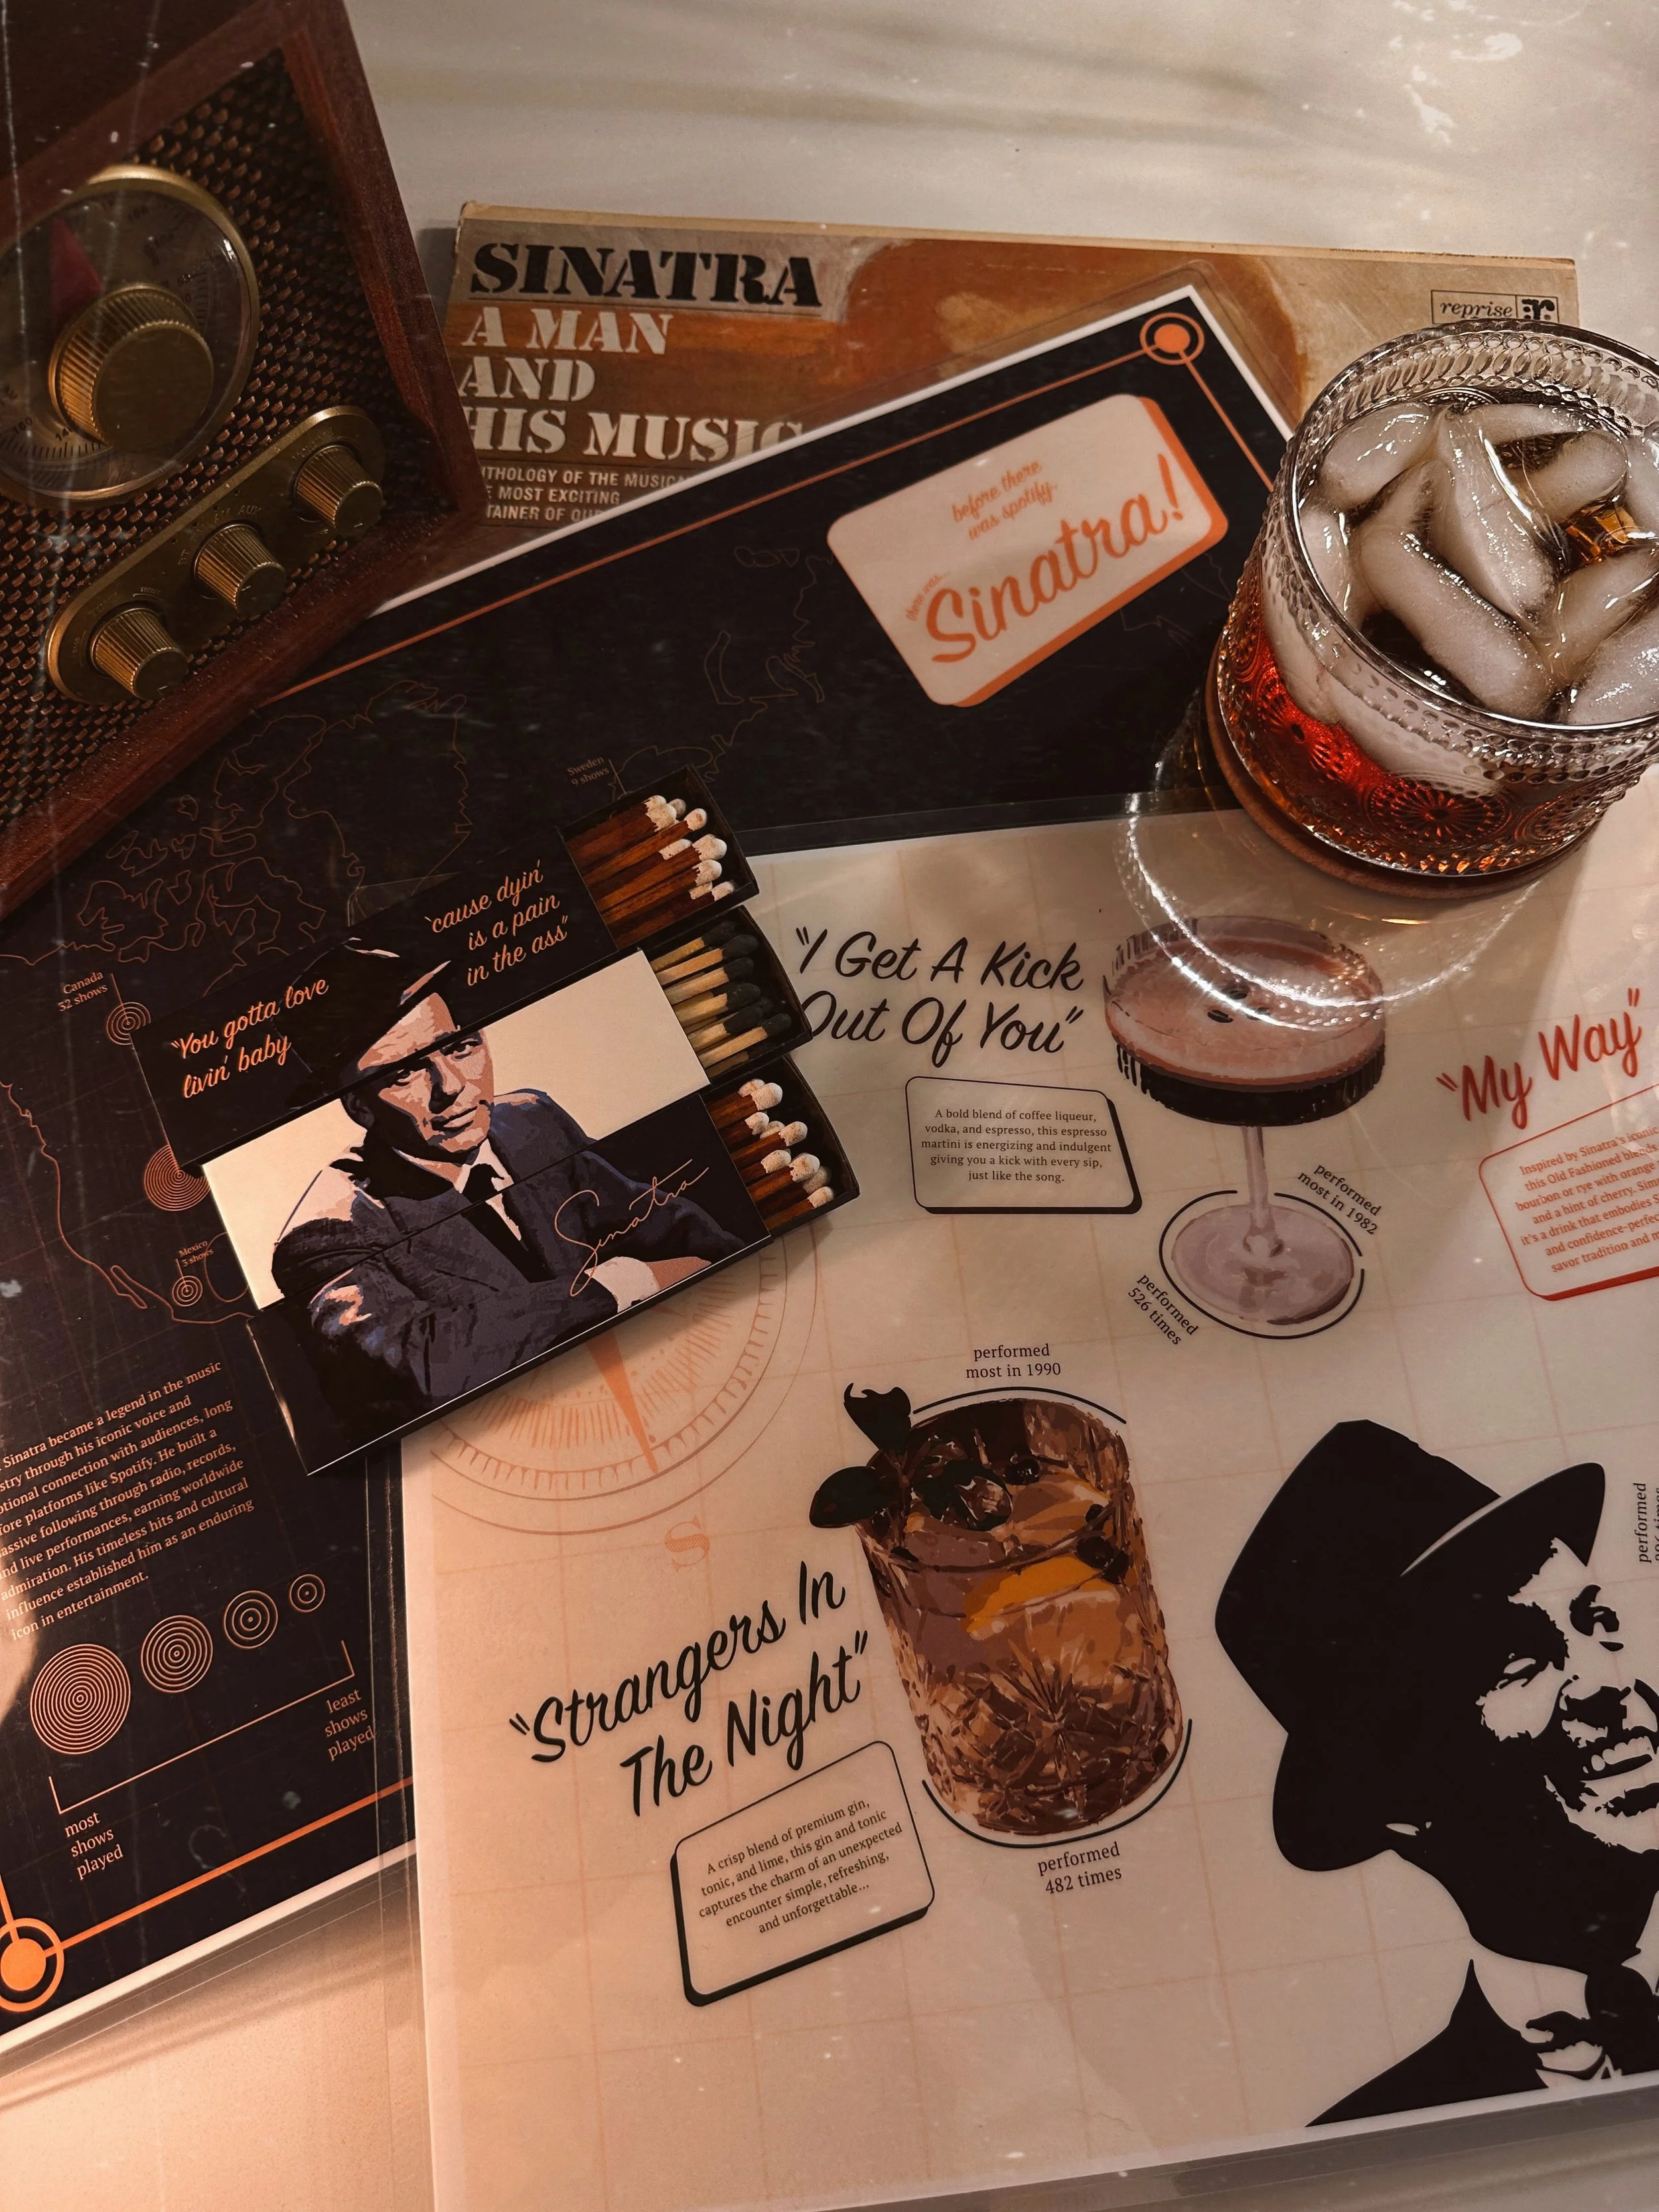
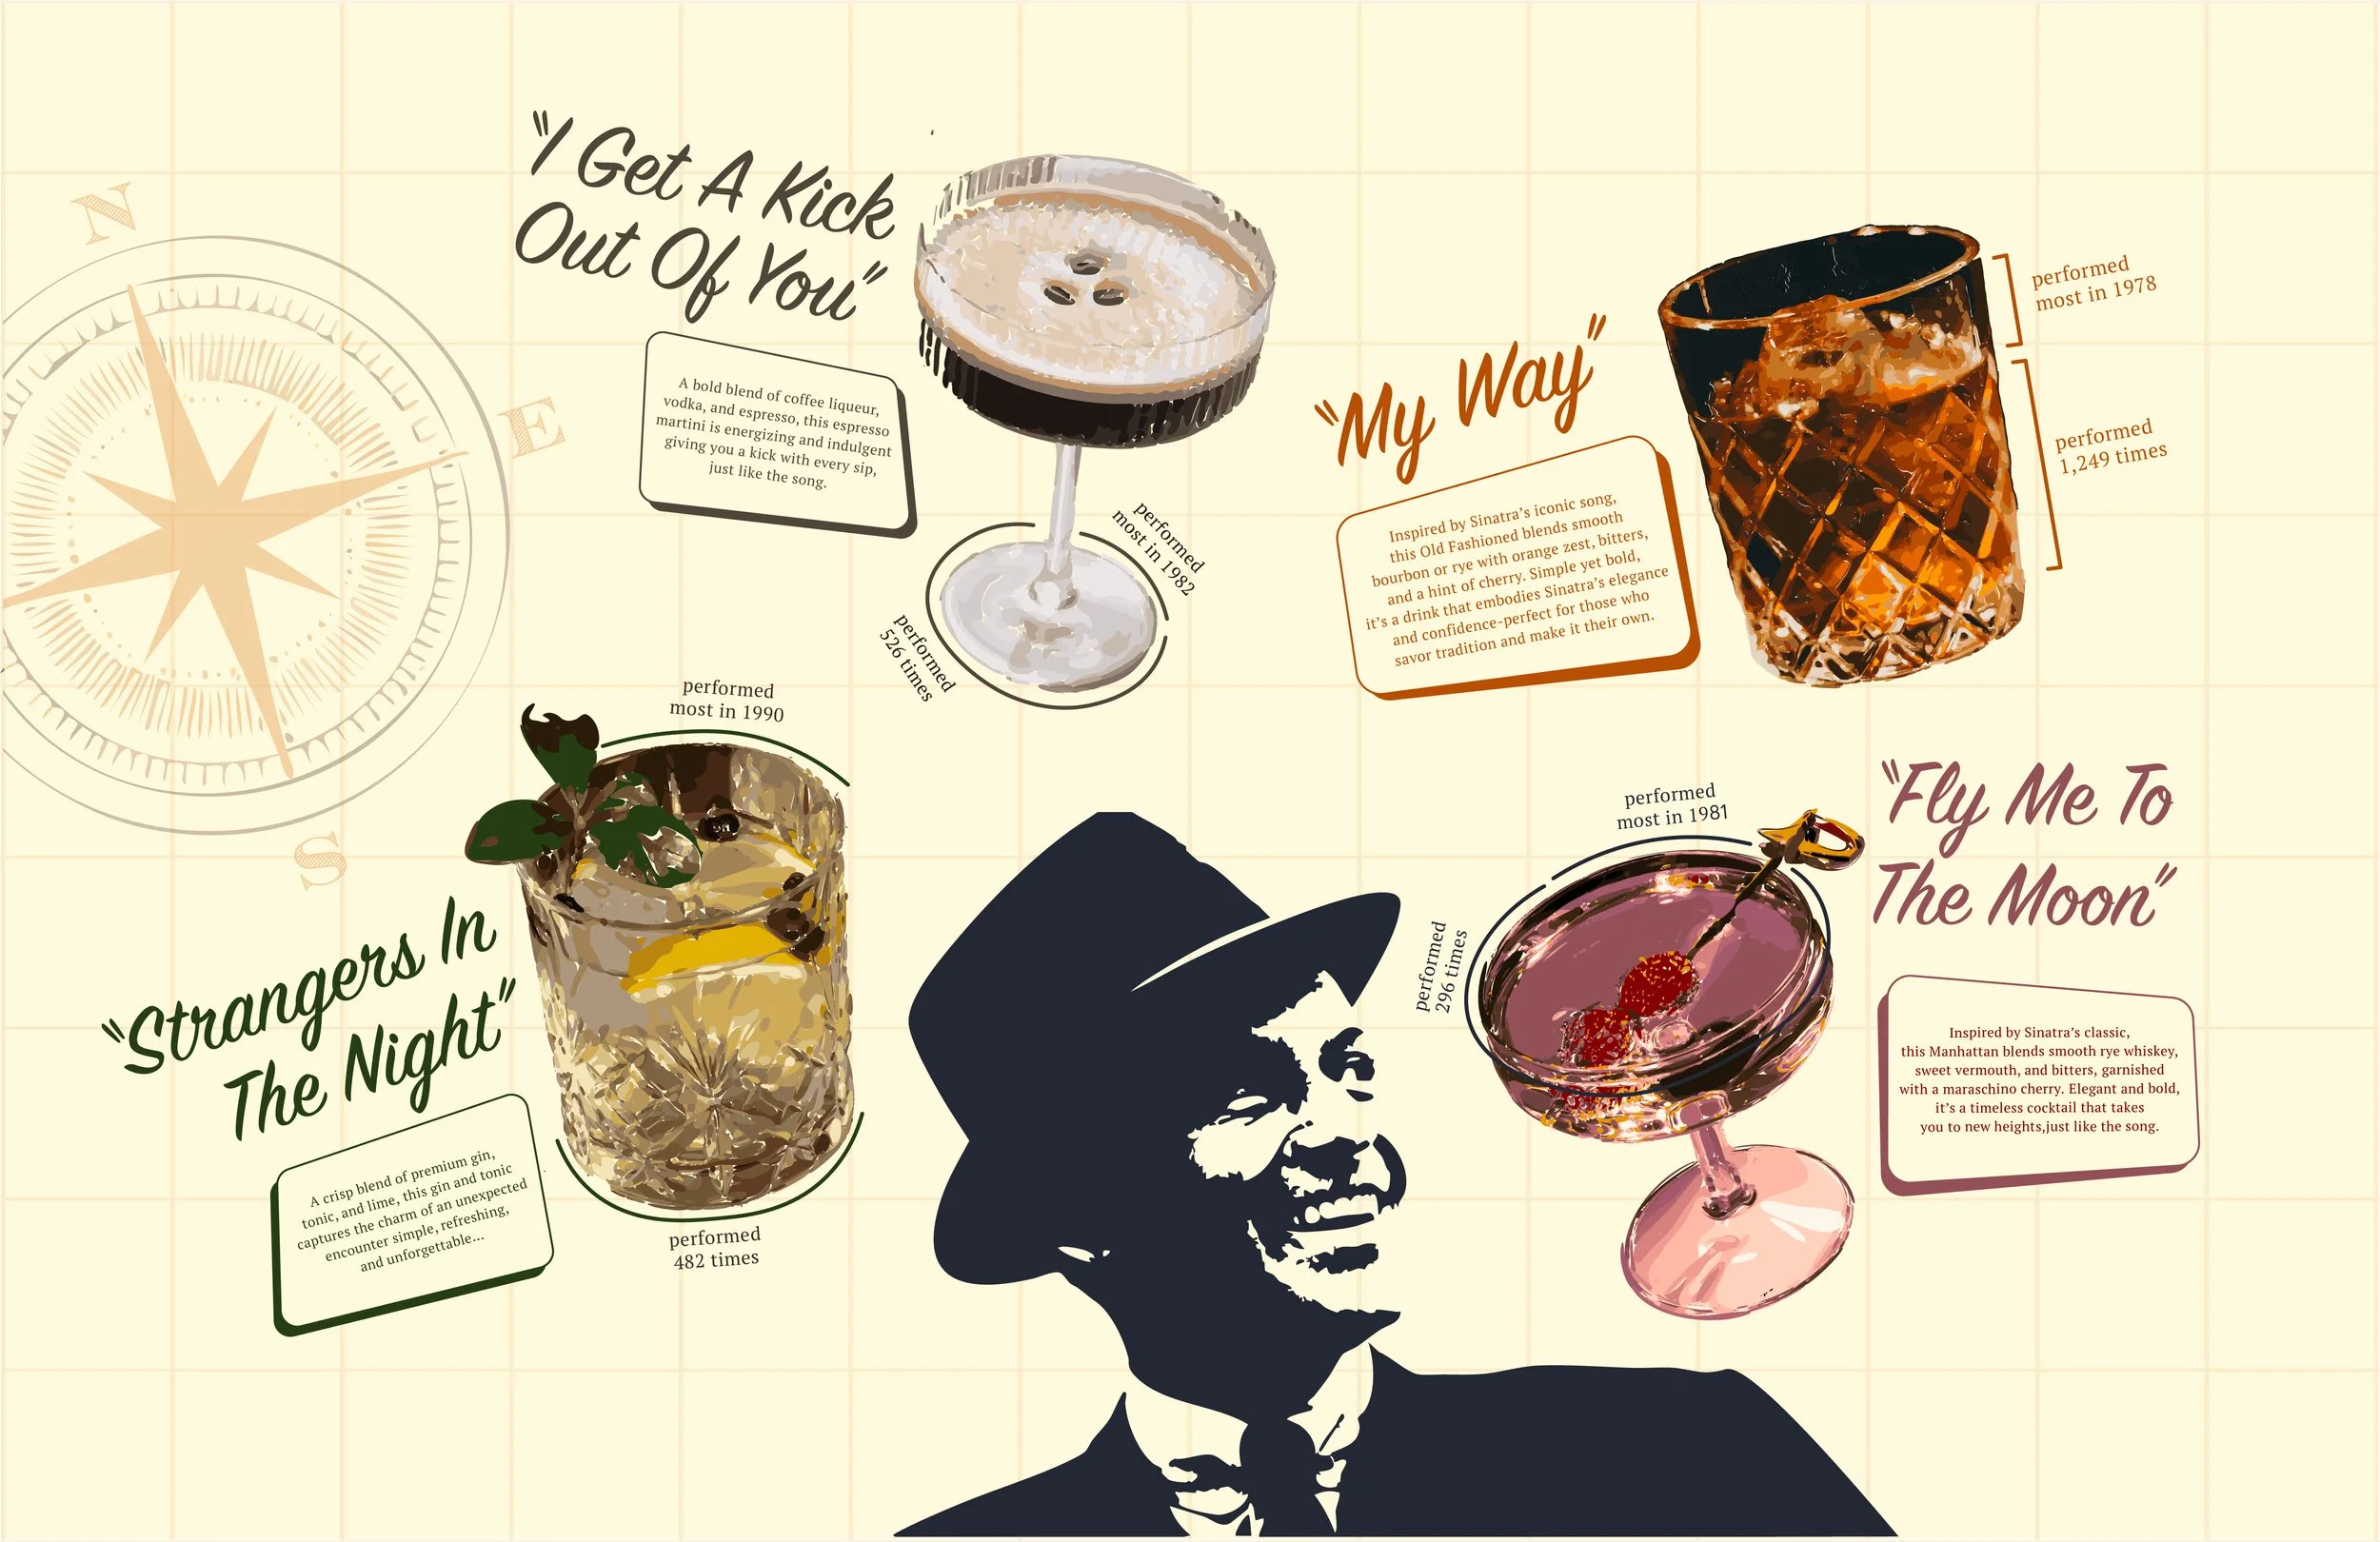
Picture yourself in a dimly lit cocktail bar, the hum of conversation, the haze of cigar smoke, Etta James and Frank Sinatra drifting from a jukebox in the corner. You look down and find a menu in front of you. Not just a list of drinks, but a story. Data visualization is about communicating without over explaining. Subtle details, like drink prices that double as song release years, invite discovery without demanding attention. The menu doesn’t just set the tone for a drink. It builds atmosphere, drawing guests into the history, music, and legacy behind what’s in their glass.
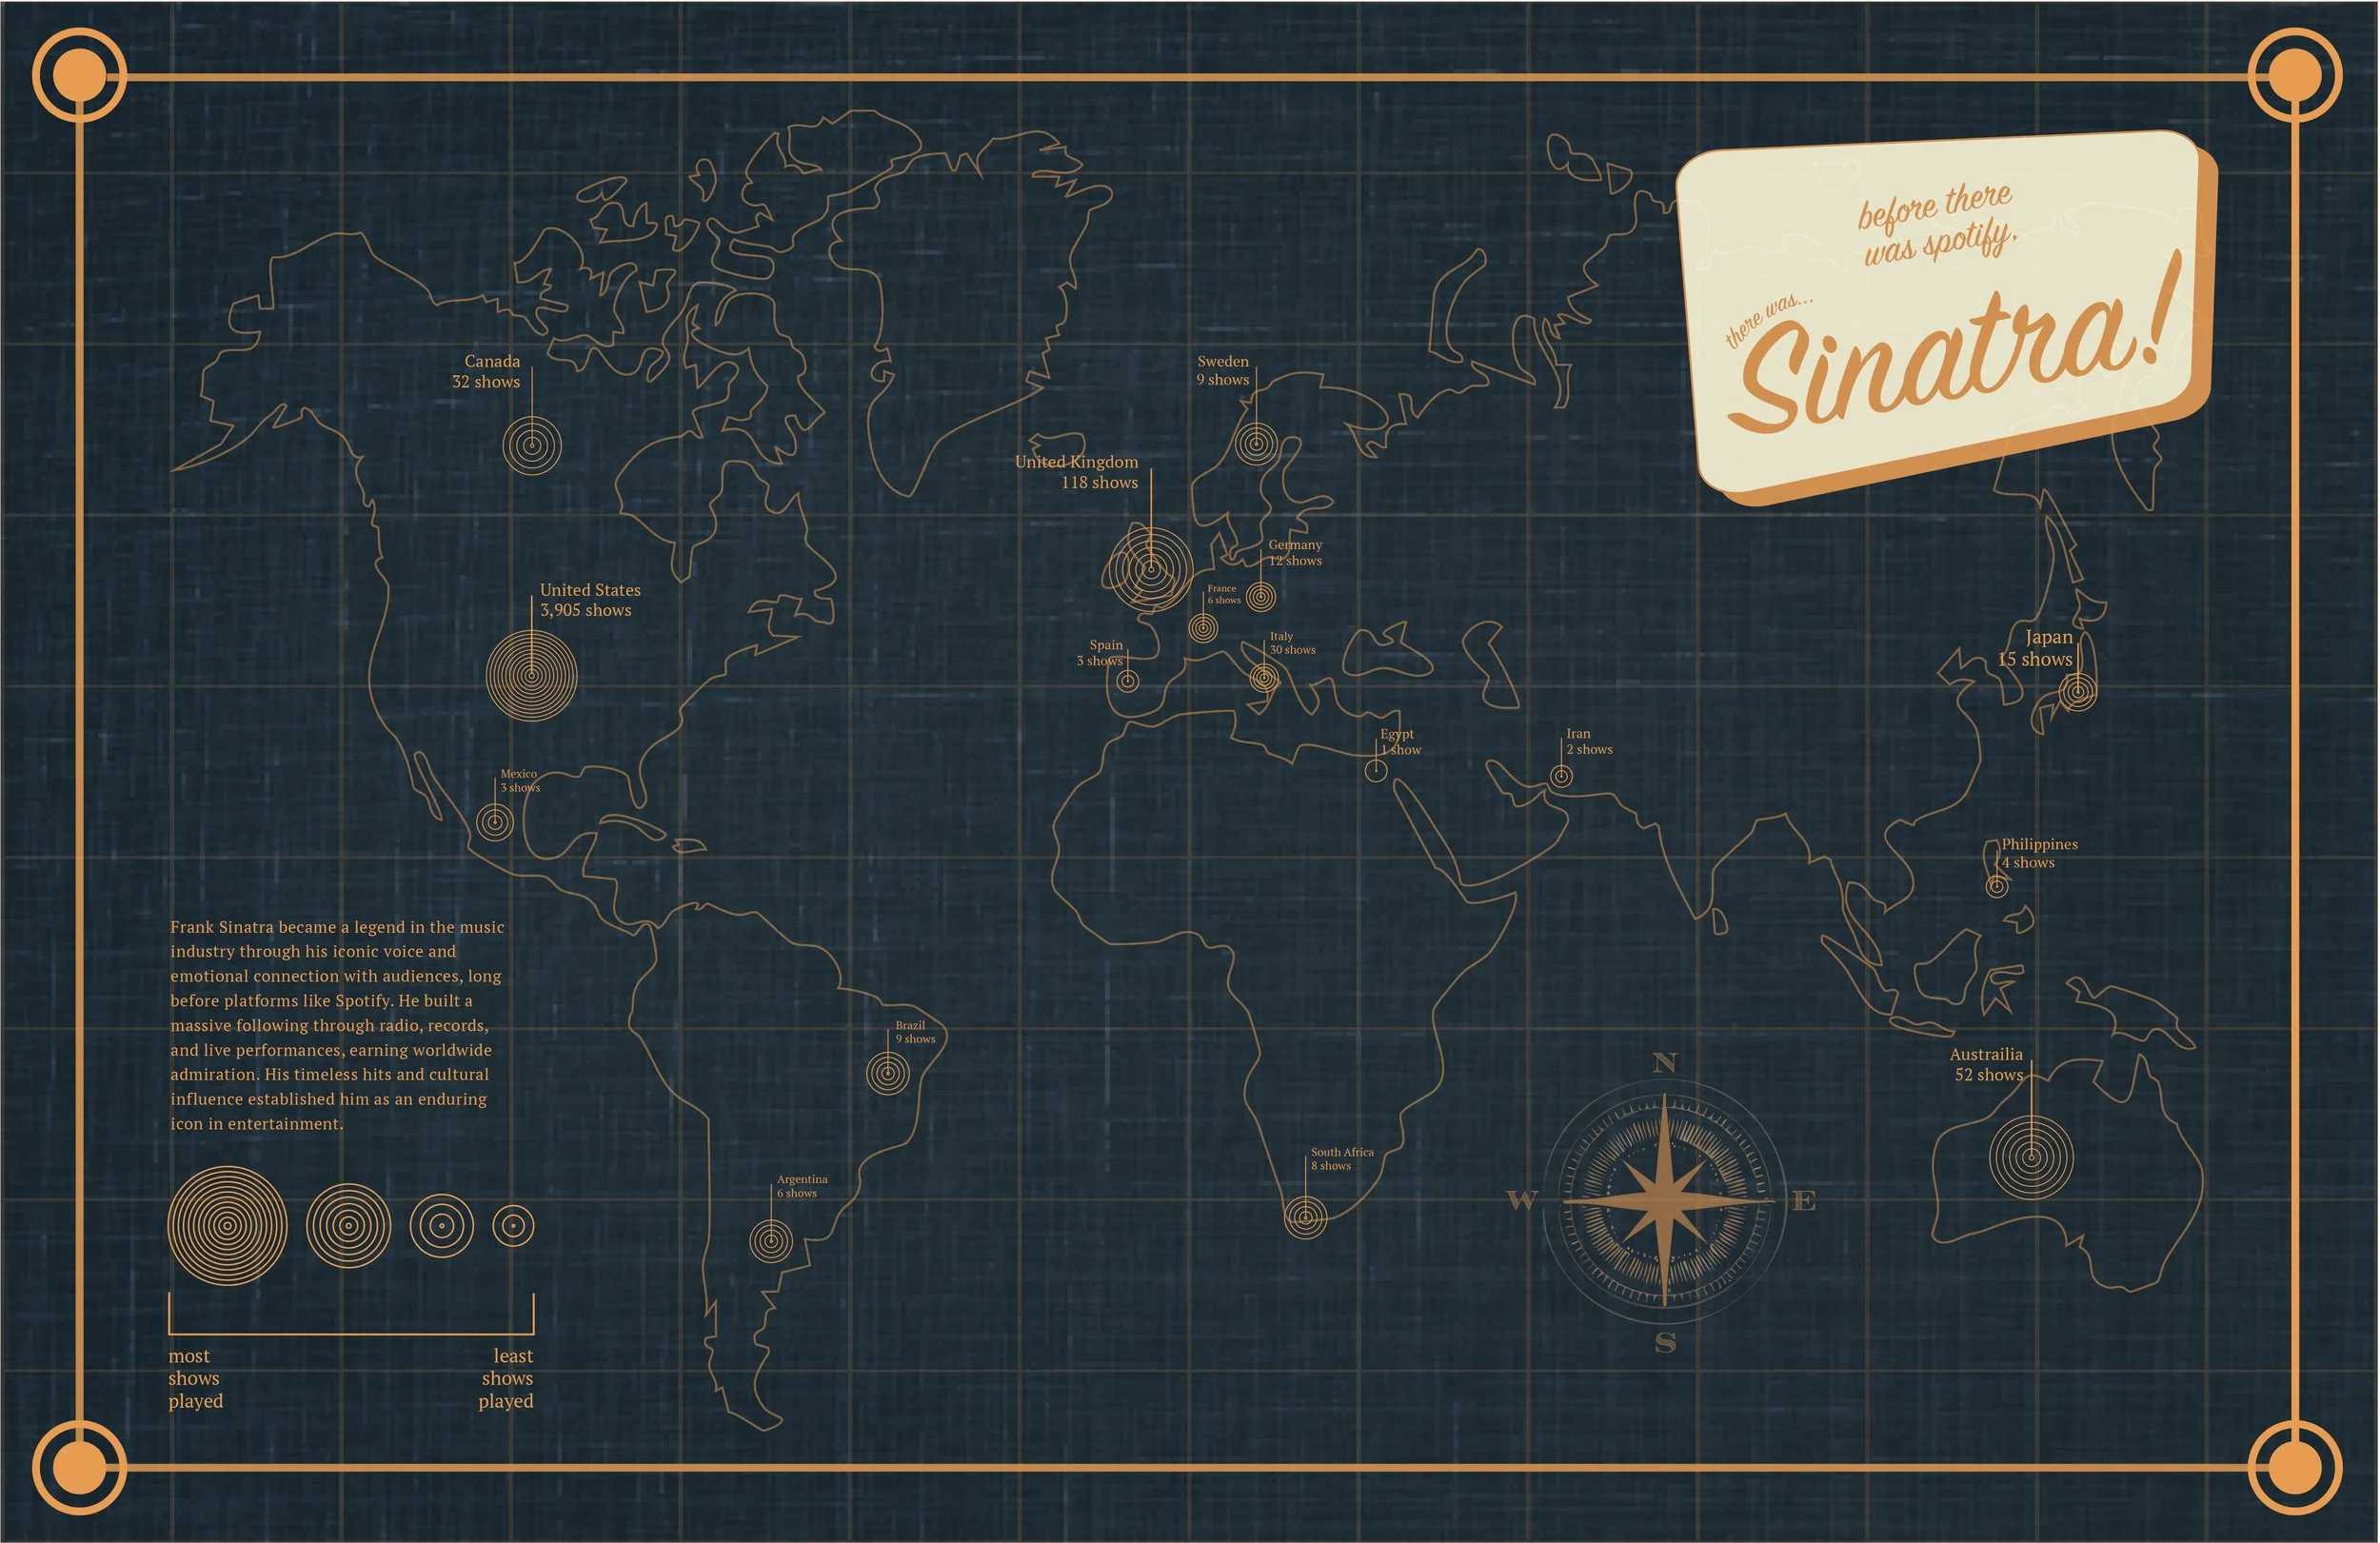
data visualization